Authors:
(1) Rui Duan University of South Florida Tampa, USA (email: [email protected]);
(2) Zhe Qu Central South University Changsha, China (email: [email protected]);
(3) Leah Ding American University Washington, DC, USA (email: [email protected]);
(4) Yao Liu University of South Florida Tampa, USA (email: [email protected]);
(5) Yao Liu University of South Florida Tampa, USA (email: [email protected]).
Table of Links
Parrot Training: Feasibility and Evaluation
PT-AE Generation: A Joint Transferability and Perception Perspective
Optimized Black-Box PT-AE Attacks
III. PARROT TRAINING: FEASIBILITY AND EVALUATION
In this section, we study the feasibility of creating parrot speech for parrot training. As the parrot speech is the oneshot speech synthesized by a VC method, we first introduce the state-of-the-art of VC, then propose a two-step method to generate parrot speech, and finally evaluate how a PT model can approximate a GT model.
A. One-shot Voice Conversion
Data synthesis: Generating data with certain properties is commonly used in the image domain, including transforming the existing data via data augmentation [92], [98], [80], [98], generating similar training data via Generative Adversarial Networks (GAN) [50], [35], [18], and generating new variations of the existing data by Variational Autoencoders (VAE) [62], [48], [53], [24]. These approaches can also be found in the audio domain, such as speech augmentation [63], [90], [64], [69], GAN-based speech synthesis [33], [65], [59], [21], and VAE-based speech synthesis [62], [55], [117]. Specifically, VC [94], [75], [70], [104], [31] is a specific data synthesis approach that can utilize a source speaker’s speech to generate more voice samples that sound like a target speaker. Recent studies [107], [40] have revealed that it can be difficult for humans to distinguish whether the speech generated by a VC method is real or fake.
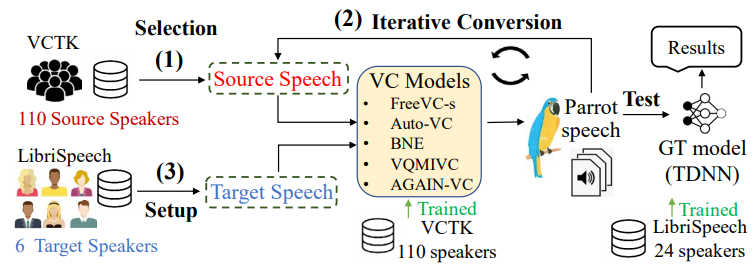
One-shot voice conversion: Recent VC has been developed by only using one-shot speech [34], [77], [110], [31] (i.e., the methods only knowing one sentence spoken by the target speaker) to convert the source speaker’s voice to the target speaker’s. This limited knowledge assumption well fits the black-box scenario considered in this paper and motivates us to use one-shot speech data to train a local model for the black-box attacker. As shown in the left-hand side of Fig. 1, a VC model takes the source speaker’s and the target speaker’s speech samples as two inputs and yields a parrot speech sample as the output. The attacker can pair the only speech sample, obtained from the target speaker, with different speech samples from public speech datasets as different pairs of inputs to the VC model to generate different parrot speech samples, which are expected to sound like the target speaker’s voice to build parrot training.
B. Parrot Speech Sample Generation and Performance
We first propose our method to generate parrot speech samples and then use them to build and evaluate a PT model. To generate parrot speech, we propose two design components, motivated by existing results based on one-shot VC methods [60], [61], [40].
- Initial selection of the source speaker. Existing VC studies [60], [61] have shown that intra-gender VC (e.g., female to female) appears to have better performance than inter-gender one (e.g., female to male). As a major difference between male and female voices is the pitch feature [70], [104], [75], which represents the basic frequency information of an audio signal, our intuition is that selecting a source speaker whose voice has the pitch feature similar to the target speaker may improve the VC performance. Therefore, for an attacker that knows a short speech sample of the target speaker to generate more parrot speech samples, the first step in our design is to find the best source speaker in a speech dataset (which can be a public dataset or the attacker’s own dataset) such that the source speaker has the minimum average pitch distance to the target speaker.
2) Iterative conversions. After selecting the initial source speaker, we can adopt an existing one-shot VC method to output a speech sample given a pair of the initial source speaker’s and target speaker’s samples. As the output sample, under the VC mechanism, is expected to feature the target speaker’s audio characteristics better than the initial source speaker, we use this output as the input of a new source speaker’s sample and run the VC method again to get the second output sample. We run this process iteratively to eventually get a parrot speech sample. Iterative VC conversions have been investigated in a recent audio forensic study [40], which found that changing the target speakers during iterative conversions can help the source speaker hide his/her voiceprints, i.e., obtaining more features from other speakers to make the voice features of the original source speaker less evident. Compared with this featurehiding method, our iterative conversions can be considered as a way of amplifying the audio features of the same target speaker to generate parrot speech.
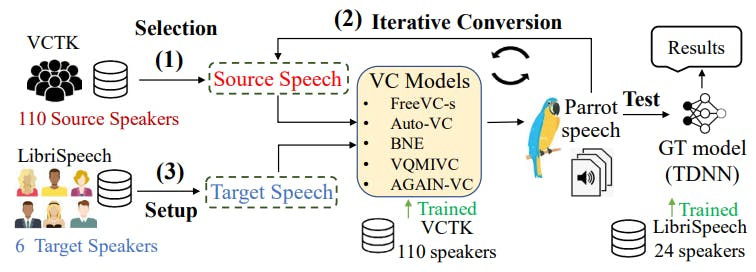
We set up source speaker selection and iterative conversions with one-shot VC models to generate and evaluate the performance of parrot speech samples in Fig. 2.
Experimental setup: There are a wide range of one-shot


VC methods recently available for parrot speech generation. We consider and compare the performance of AutoVC [9], BNE [13], VQMIVC [15], FreeVC-s [10], and AGAIN-VC [7]. As shown in Fig. 2, we use the VCTK dataset [103] to train each VC model. The dataset includes 109 English speakers with around 20 minutes of speech. We also select the source speakers from this dataset. We select 6 target speakers from the LibriSpeech dataset [87], which is different from the VCTK dataset, such that the VC training does not have any prior knowledge of the target speaker. Only one short sample (around 4 seconds with 10 English words) of a target speaker is supplied to each VC model to generate different parrot speech samples. We build a time delay neural network (TDNN) as the GT model for a CSI task to evaluate how parrot samples can be accurately classified as the target speaker’s voice. The GT model is trained with 24 (12 male and 12 female) speakers from LibriSpeech (including the 6 target speakers and 18 randomly selected speakers). The model trains 120 speech samples (4 to 15 seconds) for each speaker and yields a test accuracy of 99.3%.
Evaluation metrics: We use the False Positive Rate (FPR) [56], [29] to evaluate the effectiveness of parrot speech, i.e., the percentage of parrot speech samples that are classified by the TDNN classifier as the target speaker’s voice. Specifically, FPR = FP/(FP + TN), where False Positives (FP) indicates the number of cases that the classifier wrongly identifies parrot speech samples as target speaker’s label; True Negatives (TN) represents the number of cases that the classifier correctly rejects parrot speech samples as any other label except for the target speaker.
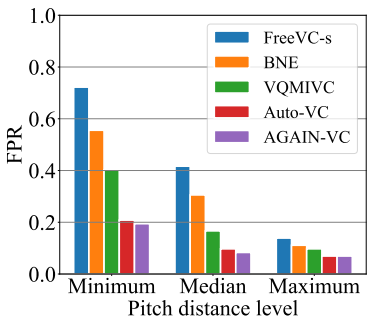
Evaluation results: We first evaluate the impact of the initial source speaker selection on different VC models. We set the number of iterative conversions to be one, and the target speaker’s speech sample is around 4.0 seconds (10 English words), which is the same for all VC models. We use the pitch distance between the source and target speakers as the

evaluation standard. Specifically, we first sort all 110 source speakers in the VCTK dataset with respect to their average pitch distances to the target speaker. We use minimum, median, maximum to denote the source speakers who have the smallest, median, and largest pitch distances out of all the source speakers, respectively. We use each VC method to generate 12 different parrot speech samples for each target speaker (i.e., a total of 72 samples for 6 target speakers under each VC method). Fig. 3 shows that the pitch distance of the source speaker can substantially affect the FPR. For the most effective VC model, Free-VCs, we can observe that the FPR can reach 0.7222 when the source speaker is chosen to have the minimum distance to the target speaker, indicating that 72.22% parrot speech samples can fool the GT TDNN model in Fig. 2. Even for the worst-performing AGAIN-VC model, we can still observe that the minimum-distance FPR (0.1944) is nearly 3 times the maximum-distance FPR (0.0694). As a result, the source speaker with the less pitch distance is more effective to improve the VC performance (i.e., leading to a higher FPR).
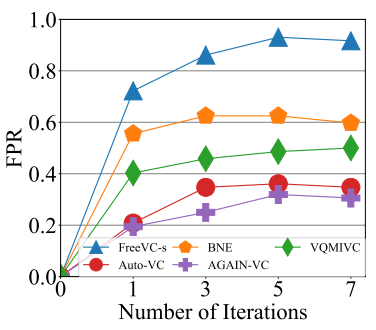
Next, we evaluate the impact of iterative conversions on the FPR. Fig. 4 shows the FPRs with different numbers of iterations for each VC model (with zero iteration meaning no conversion and directly using the TDNN to classify each source speaker’s speech). It is noted from the figure that with increasing the number of iterations, the FPR initially gains and then stays within a relatively stable range. For example, the FPR of FreeVC-s achieves the highest value of 0.9305 after 5 iterations and then drops slightly to 0.9167 after 7 iterations. Based on the results in Fig. 4, we set 5 iterations for parrot speech generation.
We are also interested in how much knowledge of the target speaker is needed for each VC model to generate effective parrot speech. We set the knowledge level based on the length of the target speaker’s speech given to the VC. Specifically, we crop the target speaker’s speech into four levels: i) 2-second length level (around 5 words), ii) 4-second level (10 words), iii) 8-second level (15 words), and iv) 12-second level: (22 words). For each VC model, we generate 288 parrot speech samples (12 for each target speaker with each different knowledge level) to interact with the GT model. All samples are generated by choosing the initial source speaker with the minimum pitch distance and setting the number of iterations to be 5.
Table II evaluates the FPRs under different knowledge levels of the target speaker. It can be seen that the length of the target speaker’s speech substantially affects the effectiveness of parrot speech samples. For example, AutoVC achieves the FPRs of 0.0972 and 0.5417 given 2- and 4-second speech samples of the target speaker, and finally increases to 0.5556 with the 12-second knowledge. It is also observed that FreeVCs performs the best in all VC methods for each knowledge level (e.g., 0.9167 for the 8-second knowledge level). We can also find that the increase in FPR becomes slight from 8-second to 12-second speech knowledge. For example, FreeVCs increases from 0.9167 (8-second) to 0.9305 (12-second), and VQMIVC increases from 0.5833 (8-second) to 0.5972 (12- second). Overall, the results of Table II reveal that even based on a very limited amount (i.e., a few seconds) of the target speaker’s speech, parrot speech samples can still be efficiently generated to mimic the speaker’s voice features and fool a speaker classifier to a great extent.
C. Parrot Training Compared with Ground-Truth Training
We have shown that parrot speech samples can be effective in misleading a GT-trained speaker classification model. Additionally, we use experiments to further evaluate how a PT model trained by parrot speech samples is compared with a GT model. We compare the classification performance of PT and GT models. Based on our findings, PT models exhibit classification performance that is comparable to, and can approximate, GT models. We include experimental setups and results in Appendix B.
This paper is available on arxiv under CC0 1.0 DEED license.

